Data Science Integration
Alexa Social
Data Science Integration
Alexa Social
Alexa Social was a net-new organization formed to increase the utility of Alexa through increasing the number of interactions. Alexa Social today is a multimodal voice + touch experience that allows users to 'follow' news, 'share' photos, music, and links, and 'react.'
'Sharing' content is one of underlying elements of Alexa Social. Today customers can 'share' music, photos, links, lists to other Alexa customers. Each of these 'sharing' actions was produced by a different product team. The purpose of this work was to baseline the current experience so that teams know how to prioritize investments in feature iteration, and how much feature iterations improve the experience by comparison. By integrating qualitative data and analytics from data science, this research revealed tangible next steps to improve the product.
Challenge
-
No research had been done on these 'sharing' features being used in live production software
-
Decisions were being made about future design investments without sufficient data about the current investment.
-
Sharing was defined and implemented differently by different teams (photos, music, shopping, etc)

What is the mental model of sharing?
What behavioral signals should we add to existing metrics?
Key Activities
-
Conducted this remote research study with a large qualitative dataset
-
Partnered with data science to integrate organizational instrumentation MAU (Monthly Active Users) metrics
-
Provided multi-dimensional data to back up insights for tangible recommendations
Methodology
-
Conducted dscout diary study (n=49) across 4 content types (music, photos, links, lists).Each cohort had a different content type.
-
Participants were asked to record a video of them 'sharing' 4x over 10 days, each share was spaced out by 2 days.
-
Each 'sharing' task was scored based on success criteria.
-
The first time a participant attempted the sharing task was the cleanest read on the experience so a dashboard was created to compare the task success for first attempts (as well as full analysis across all tasks)
-
Integrated data analytics by evaluating MAU (Monthly Active Users) instrumentation and comparing task-based experiences to measurable datapoints

Content type 1
Content type 2
Content type 3
Content type 4
Green = success with 1 attempt
Orange = success after multiple attempts
Red = not successful
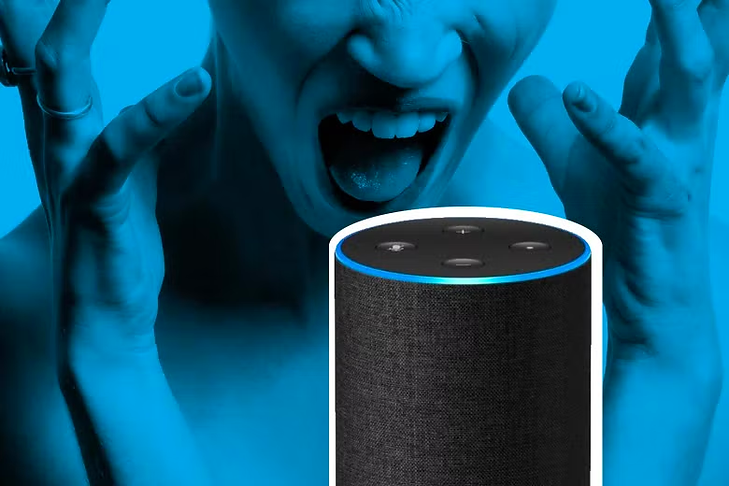
Scoring of task success for the first task indicated big differences in ease of use for each content type (music, photos, links, lists) and there were some very upset customers.
These results told a different story than the measured analytics.

The research revealed a conceptual model mismatch. We had instrumented the organizational structure rather than how the customer is thinking about 'sharing.'
Impact
-
The data dashboard was further documented and is now in the process of being re-designed.
-
Made the case for developing a unified CX (customer experience) for sharing content across different domain teams (photos, music, shopping, etc)
-
Changed the approach to publishing Q&A content. Alexa was the first place customers sought 'sharing' troubleshooting help. Alexa needed the knowledge to answer direct questions about how to share.